波动率交易的核心关键:理解 VIX 期货的展期收益

在进行波动率交易时,尤其是通过像 SVXY、VXX 和 VIXY 这类与交易所挂钩的产品(ETPs)来交易,存在一个支撑所有价格走势的核心概念:展期收益(roll yield)

对于那些想要利用市场波动率来指导投资和交易的人来说,理解 VIX 期货及其与更广泛市场之间的关系至关重要。而展期收益这一概念,恰恰能解释为什么波动率产品有时会出现令人费解的表现,以及它们如何对市场变化作出响应。

如果你目前还不了解什么是波动率,那强烈建议你先阅读 如何从波动率策略中获利:美股 VIX与市场风暴机会 ,带着疑问再回来看这篇深度解析的文章。

什么是 VIX 期货的展期收益?

展期收益(roll yield) 是指数现货价格与期货价格随时间推移而产生的差异。在波动率 ETPs 的语境下,展期收益描述的是 VIX 期货(基于市场对波动率的预期而交易的期货合约)与 VIX 指数本身(反映当下市场波动率)之间的关系。
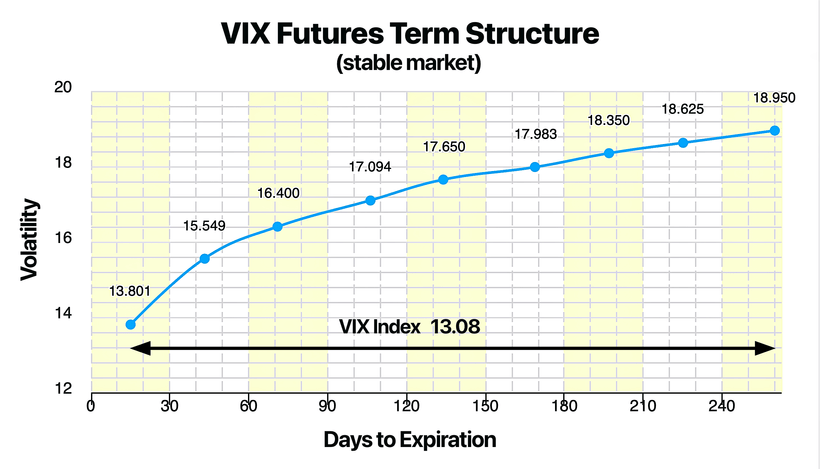
图表 1:VIX 期货期限结构
图示:稳定市场下的 VIX 期货期限结构 | 图片来源:vixcentral.com

诸如 VXX(做多波动率)和 SVXY(做空波动率)等波动率 ETPs 都基于 VIX 期货,并且只关注最近的两个月期货合约(我称之为 VX1 和 VX2)。这两个合约会被不断地再平衡(rebalanced)并进行配比,从而维持一个30 天常数到期日的合成 VIX 期货,我将其称之为 VXS30。这个 30 天常数到期日合成 VIX 期货的走势至关重要,因为它会直接影响到多头和空头波动率 ETPs 的表现。

举例来说,在做多波动率的产品 VXX 中,如果 VXS30 上涨,那么 VXX 的价格就会上涨;如果 VXS30 下跌,那么 VXX 的价值就会衰减。另一方面,对于反向产品 SVXY 来说,则恰恰相反:当 VXS30 上涨时,SVXY 下跌;当 VXS30 下跌时,SVXY 上涨。

VIX 期货的运作机制

VIX 期货是针对 VIX(基于对标普 500 指数期权的市场波动率测度)未来水平进行投机的合约。它们在市场上不断交易,买卖双方根据各自对未来波动率的预测来决定交易方向。
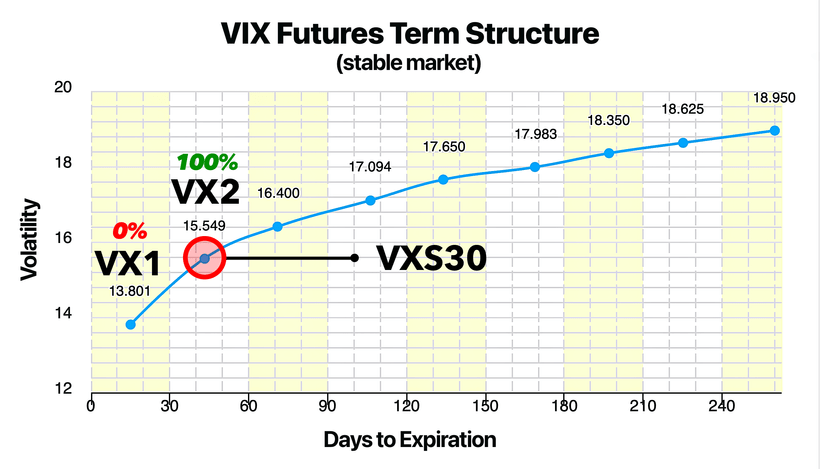
图表 2:VIX 期货期限结构
图示:在一个稳定市场下,VIX 期货期限结构中展示了月初时的 VXS30(当 VX1 刚开始到期周期)| 图片来源:vixcentral.com

在每个月的 VIX 期货到期周期开始时,VXS30 由 100% 的近月合约(VX1)构成,而第二个月合约(VX2)的比重为 0%。随着月份的推移,为了维持这个“30 天常数到期日”的特性,VXS30 会逐渐卖出部分 VX1 并买入部分 VX2(即第二个月的 VIX 期货)。

图表 3:VIX 期货期限结构 | VXS30 向 VX2 推进
图示:在一个稳定市场下,VIX 期货期限结构显示当 VXS30 接近到期周期尾声时,它向 VX2 移动的过程 | 图片来源:vixcentral.com

到每个月到期周期结束时,VXS30 会变为 100% 由 VX2 构成,而 VX1 则变为 0%。这种再平衡本身对价格没有直接影响;然而,在这个再平衡过程中所产生的展期收益,却对波动率 ETPs 的定价有着显著影响。

图表 4:VIX 期货期限结构 | VXS30 = VIX(到期时)
图示:VIX 期货期限结构在一个稳定的市场中,VX1 在到期时与 VIX 数值相当 | 图片来源:vixcentral.com

这种过程每个月都会发生:到期日的 VX1 与 VIX 本身数值相等(即同步),VX2 变成新的 VX1,VX3 变成新的 VX2,以此类推,依次推动每个月的 VIX 期货循环往复。

正展期收益与负展期收益

VXS30 与 VIX 指数之间的关系,界定了展期收益。一般而言,有两种情形需要考虑:

  1. 正展期收益(Positive Roll Yield)
    当 VXS30 的交易价格高于 VIX 指数的现货价格时,它在到期日到来之前,很可能会随时间推移而下行,并逐渐向到期时的 VIX 指数靠拢。这种下跌会导致做多波动率 ETP(如 VXX)的价值减少,同时推高做空波动率 ETP(如 SVXY)的价值。
  2. 负展期收益(Negative Roll Yield)
    当 VXS30 的交易价格低于 VIX 指数的现货价格时,情况则相反。VXS30 很可能会随着到期的临近而上涨,并逐渐向 VIX 指数靠拢。在这种情况下,VXX 和 UVXY 这类做多波动率 ETP 受益,它们的价值会随着 VXS30 的上涨而上升;而做空波动率的产品(如 SVXY)则会贬值。

展期收益与市场环境

理解不同市场环境下展期收益的表现,对波动率交易者而言至关重要。在相对稳定的市场环境中,VIX 往往保持在较低水平,VIX 期货一般呈现期货升水(Contango),即期货合约价格高于当前 VIX 指数。这常常表现为期限结构曲线沿着高于 VIX 的位置向上倾斜。

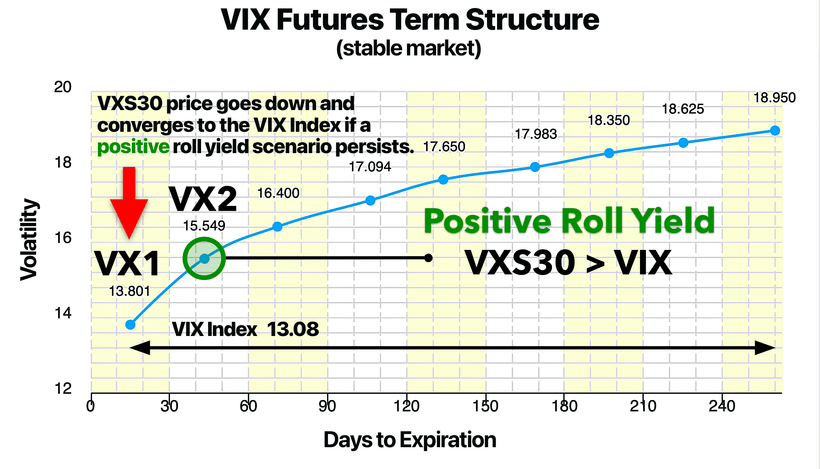
图表 5:VIX 期货期限结构 | 正展期收益
图示:在一个稳定的市场环境中,VXS30 > VIX,表示出现正展期收益 | 图片来源:vixcentral.com

这种情况会产生正展期收益,从而逐步侵蚀做多波动率 ETP 的价值,让它们随着时间推移而贬值。这也解释了为什么 VXX 等产品自推出以来已经下跌超过 99%——正展期收益使其不断衰减。

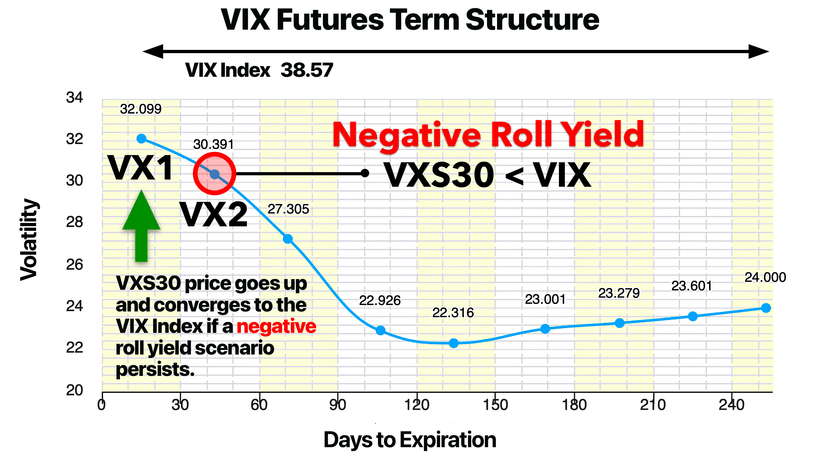
图表 6:VIX 期货期限结构 | 负展期收益
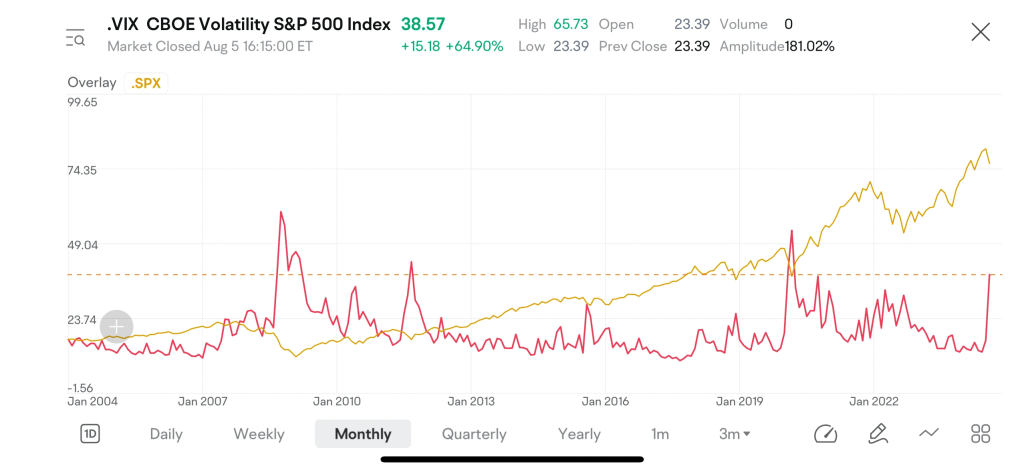
图示:在一个不稳定的市场环境中,VXS30 < VIX,表示出现负展期收益 | 2024年8月5日 | 图片来源:vixcentral.com

另一方面,在波动剧烈或混乱的市场环境中,比如市场崩盘时,VIX 通常会飙升,而 VIX 期货可能进入期货贴水(Backwardation),此时现货 VIX 价格高于期货价格。这种情况下,就会出现负展期收益,推动做多波动率产品(如 VXX 和 VIXY)的价值上涨。

举例来说,在最近一次波动率飙升——2024年8月期间,日本利差交易(carry trade)的崩盘导致 VIX 指数飙升至 65。当时,VXS30 远低于 VIX 指数,形成了负展期收益。随着 VXS30 开始上行,做多波动率的 ETP 也随之飙升。

用一个真实案例,展示了如何抓住难得的行情机遇:2024 年 8 月 2 日(星期五),VIX期货有进入期货贴水的迹象,买入 VXZ(中期做多波动率 ETP);到了 8 月 5 日(星期一),期货贴水逐步减弱马上卖出VXZ,在短短一天内就斩获了 12% 的可观收益。更值得一提的是,如果当时换成买 VIXM,回报率可以达到 22%——这就是如何在小小的市场混乱中收获可观利润的实例!

展期收益对波动率 ETP 的影响

在了解了展期收益的基本概念后,让我们进一步探讨这一现象如何影响特定的波动率产品:

VXX 和 VIXY(做多波动率)

VXX 和 VIXY 持有的是近月和次近月的 VIX 期货多头头寸。当 VIX 期货期限结构发生变化时,这些产品会受到展期收益的影响。在典型的期货升水(正展期收益)环境下,VXX 和 VIXY 的价值会随着 VIX 期货价格向现货 VIX 指数收敛而不断贬值(参见上文图表 5)。
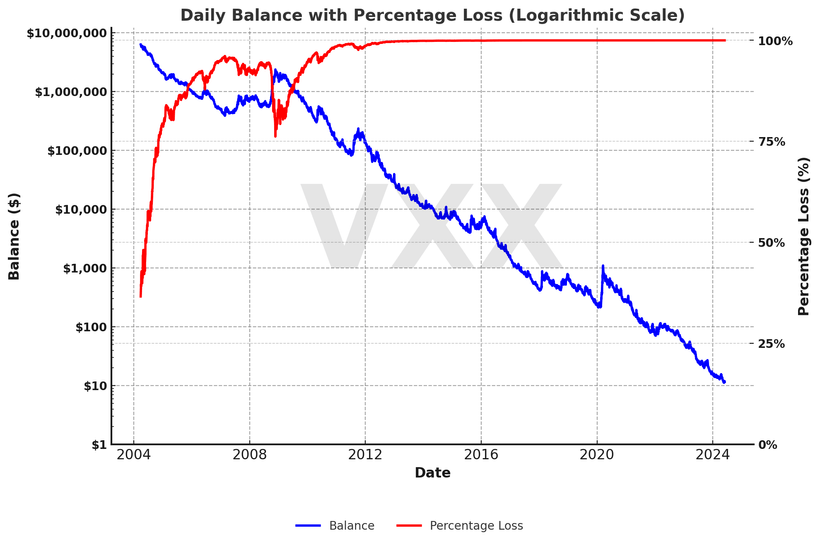
图表 7:VXX 的假设交易场景
对数坐标图:这是对 VXX 进行长期买入并持有(千万不要这么做)的一个假设情况。假设最初投入 1,000 万美元,如今账户余额仅剩不足 12 美元,跌幅高达 99.99%。VXX 于 2009 年推出,上述数据在此之前做了回溯模拟至 2004 年 3 月 26 日。

随着时间的推移,这会导致做多波动率产品遭受重大损失,这也是为什么 VXX 和 VIXY 自诞生以来已经下跌了 99.9% 的原因。

然而,在出现期货贴水(负展期收益)的时期,VXX 和 VIXY 可能获得显著的涨幅。当 VIX 飙升、而 VIX 期货价格滞后时,展期收益由正转负,VXX 和 VIXY 会因为期货价格向高企的 VIX 指数靠拢而受益(参见上文图表 6)。

SVXY(做空波动率)

SVXY 则采取相反的操作方式——它持有近月和次近月 VIX 期货的空头头寸。在正展期收益环境(期货升水)下,VIX 期货价格趋于下行,SVXY 因而受益并上涨。这正是为什么在低波动率、稳定市场中,SVXY 通常能获得较为一致的收益。

但需要注意的是,在负展期收益环境(期货贴水)下,SVXY 面临巨大风险。当 VIX 期货价格上行以接近更高的现货 VIX 指数时,SVXY 就会出现大幅亏损。2018 年 2 月的 “Volmageddon” 事件就是典型案例,SVXY(1 倍杠杆)在一天之内暴跌逾 80%。自那之后,SVXY 的杠杆倍数被降至 0.5 倍,使其在波动率交易中风险相对可控。

展期收益的长期动态

鉴于展期收益的机制及典型市场环境,很容易理解为何做多波动率的产品(如 VXX 和 VIXY)会随着时间推移而不断贬值。自 2004 年 VIX 期货推出以来,VIX 期货期限结构在 80% 以上的时间处于期货升水(正展期收益),这就导致做多波动率 ETP(VXX、VIXY、UVXY 等)长期处于下行趋势,价格不断被展期收益侵蚀。与此相反,做空波动率的产品(如 SVXY)在这段时间里则从持续的升水环境中受益,获得了正面的长期回报。

如何运用展期收益进行交易

了解了展期收益对波动率 ETP 的影响之后,交易者可以将这一认识应用到交易策略中。

1. 交易做多波动率 ETP
如果想利用 VXX 或 VIXY 等产品获取收益,交易者需要密切关注市场环境。由于在稳定市场中正展期收益会让这些产品的价值不断下降,因此最好在高波动或市场不确定性较强时(即负展期收益开始发挥作用时)再考虑介入。

需要强调的是,想要恰到好处地把握此类交易时机极其困难。针对这种情况,个人更偏好使用 VIXM(一个跟踪更远期合约的做多波动率 ETP)。我平均一年中只在不到 3% 的交易日里会用到它。VIXM 相较 VXX 和 VIXY 来说波动更小,因为它关注 VX4 到 VX7 等期限更长的 VIX 期货合约,因此在交易时心理压力也相对更可控。

2. 交易做空波动率 ETP
对于想在稳定市场环境下(即期货升水、正展期收益的常态)获得更稳定回报的交易者而言,SVXY 这样的逆向波动率产品是一个相对更有吸引力的选择。不过,必须警惕在市场崩盘或波动率飙升时期,展期收益会迅速转变为负值,导致 SVXY 的严重亏损。

我采用了一种精密、量化且基于规则的策略来应对这些潜在风险。不管是交易 ETP 还是股票,我都能及时在严重亏损发生前切换到更安全的头寸,保护资金,直到市场波动性下降、恢复稳定。这的确是一套行之有效、可赢利的强大组合策略。

“在混乱中寻得清晰,才能发现机遇所在。”

结论

在波动率交易的世界里,理解 VIX 期货的展期收益 至关重要。它决定了各种波动率 ETP 的价格走势,并解释了像 VXX 这类产品为何会在长期表现上不断贬值。通过关注 VIX 期货期限结构以及 VXS30 与现货 VIX 指数的关系,交易者可以更准确地判断何时应该买入或卖出波动率产品。无论是在混乱市况中交易做多波动率 ETP,还是在稳定市况下交易做空波动率 ETP,展期收益都是驾驭波动率交易世界的重要钥匙。

Profit from U.S. Market Volatility: VIX ETFs, Trading Strategies, and Earnings Opportunities

1. What is Volatility? How is it Measured? An Overview of the VIX Index

In mid-July 2024, the U.S. stock market was thriving, with major indices reaching record highs. However, within a month, everything changed. The first three trading days of August delivered a “triple blow,” as both the S&P 500 and NASDAQ plummeted. At the same time, the VIX index—known as the “fear index”—surged by an astonishing 108%. But what exactly is the VIX, why is it significant, and how can investors profit from market volatility?

The VIX Index (often called the fear index) is one of the most closely watched volatility indicators, introduced by the Chicago Board Options Exchange (CBOE). It measures the implied volatility of the S&P 500 over the next 30 days. The VIX generally moves inversely to market sentiment—when anxiety rises, the VIX increases; when the market stabilizes, the VIX declines. The VIX value is expressed as an annualized percentage. For instance, a VIX level of 17 implies an expected annualized volatility of 17%, which equates to a 4.9% expected monthly movement (17% ÷ √12 = 4.9%).

VIX and S&P500 index chart

In the U.S. market, volatility represents the magnitude and frequency of price changes. A higher VIX suggests that investors anticipate larger future price swings. However, a rising VIX doesn’t always signal a market downturn. While an increasing VIX typically reflects negative sentiment, a declining VIX is often associated with market recovery.

For example, during the 2008 Global Financial Crisis, the S&P 500 plunged over 40%, while the VIX soared above 80, reflecting extreme panic. Conversely, after the 2021 vaccine rollout, the U.S. stock market stabilized, and the VIX dropped below 20, signaling calmer conditions.

VIX index from 2000 to 2024

2. Volatility Trends: Why Can You Profit from Volatility?

Volatility follows predictable patterns:

  • Mean Reversion: Volatility tends to revert to a long-term average. Extreme highs or lows often stabilize over time.
  • Asymmetry: The U.S. market tends to decline faster and more sharply than it rises, causing the VIX to spike during downturns and decrease slowly during rallies.
  • Risk Premium: Investors typically pay a premium for options to hedge against risk, which keeps implied volatility higher than realized volatility.

Since volatility tends to move according to these patterns, investors can use volatility derivatives to capitalize on situations where volatility is either too high or too low. For example, when the market is gripped by excessive fear and volatility is elevated, shorting volatility offers profit opportunities. Conversely, during calm markets with potential risk events, going long on volatility products can deliver significant returns.

The VIX fear index also provides valuable insight into the broader market and individual stocks. When the VIX rises, it indicates heightened market anxiety. Sharp increases typically point to major disruptions such as wars, financial crises, or natural disasters, often leading to swift market declines. During these times, panic selling is common, but value investors may view these events as “buying opportunities” and follow the principle of “be greedy when others are fearful.” On the other hand, when the VIX declines and remains low, it signals market stability and overall optimism, although it may also lead to investor complacency.

Historically, the VIX has ranged between 10 and 30. Analysts often use 30 as a benchmark for high volatility and market fear. A VIX below 20 usually indicates market stability, while a VIX below 15 may suggest a market bubble.

3. How to Go Long on Volatility

VXX and UVXY Strategy Examples

Going long on volatility involves profiting from expected market turbulence, usually in anticipation of significant events or declines in the U.S. market.

UVXY and VIX chart
  • Buying VIX ETFs/ETNs: Products like VXX and UVXY track VIX futures. When the VIX rises, these ETFs increase in value. For example, buying UVXY can provide leveraged returns during market disruptions.
  • Buying Put Options: Purchasing put options on major indices can lead to profits as volatility increases and option premiums rise.

Steps to Implement:

  1. Identify potential risk events (e.g., earnings reports, economic data releases).
  2. Choose appropriate VIX-related products or options contracts.
  3. Set clear stop-loss and take-profit levels.

4. How to Short Volatility

Shorting volatility involves profiting from declining market turbulence, which is ideal in calm markets.

SVIX and VIX chart
  • Buying Inverse VIX ETFs: Products like SVIX short VIX futures and generate returns when volatility declines.
  • Selling Call Options: Selling call options provides premium income if the market is unlikely to rally.

Steps to Implement:

  1. Evaluate if the VIX is at a high level with room to decline.
  2. Choose a suitable ETF or option strategy based on market conditions.
  3. Monitor volatility and adjust positions accordingly.

5. Long vs. Short Volatility: Which is Better?

StrategyMarket ConditionsRiskReturn Potential
Long VolatilityHigh-risk eventsHighHigh
Short VolatilityStable marketMediumSteady

For most individual investors, shorting volatility is generally easier than going long. This is because it’s difficult to predict when a black swan event will cause volatility to spike, but it’s often possible to seize the opportunity to short volatility after a spike and profit from its decline.

If market direction is uncertain in your mind, multi-leg option strategies can be useful:

  • Straddle Strategy: Simultaneously buy call and put options at the same strike price to profit from large market moves.
  • Iron Condor Strategy: Sell a range of call and put options with hedges to profit from market stability while limiting losses.

6. Risk Considerations

Effective risk management is crucial in volatility trading. Common risks include:

  • Market Volatility Risk: Prices can fluctuate drastically during major events.
  • Leverage Risk: Leveraged ETFs and options amplify both gains and losses.
  • Expiration Mismatch Risk: Futures and options contracts may have different expiration dates, impacting returns.
  • Liquidity Risk: Bid-ask spreads may widen during extreme volatility, making it harder to exit positions.

7. Essential Knowledge for Investors

To manage these risks effectively, investors should understand:

  1. Derivatives Basics: Know how options and futures work.
  2. Volatility Metrics: Learn to interpret the VIX and implied volatility.
  3. Risk Management: Set appropriate stop-loss and take-profit points.
  4. Market History Analysis: Review past market events and their impact on volatility.
  5. Real-Time Market Monitoring: Stay updated with market news and economic releases.

By setting clear targets, maintaining proper position sizes, and closely monitoring trends, investors can navigate volatility trading with greater confidence.

Implementing strategies such as “U.S. market volatility trading techniques” and “low-risk income strategies” can further enhance trading success. Remaining disciplined and adaptive to changing market conditions is key to long-term growth.